-
9 تحديات لرسم خرائط درجات الحرارة في الزراعة السعودية — وكيف تحلها الدراسات المتخصصة دراسة توزيع درجات الحرارة

تواجه الزراعة في المملكة العربية السعودية تحديات مناخية فريدة من نوعها. فدرجات الحرارة المرتفعة، وانخفاض الرطوبة، والتقلبات الحرارية المستمرة تؤثر بشكل مباشر على جودة المحاصيل وسلامة التخزين الزراعي. ولهذا السبب أصبحت دراسة رسم خرائط درجات الحرارة أداة أساسية لضمان التحكم البيئي الدقيق في جميع مراحل الإنتاج والتخزين والنقل. تقدم شركة Redlines عبر موقعها الإلكتروني www.Redlines.sa…
-
9 Temperature Mapping Challenges in Saudi Agriculture — And How Studies Solve Them

Agriculture in Saudi Arabia faces unique climatic challenges. With extreme heat, low humidity, and frequent temperature fluctuations, protecting crops and agricultural assets requires precise environmental control. This is where temperature mapping studies become essential. For farmers, agronomists, and supply chain managers, understanding how temperature behaves across storage and cultivation environments directly affects crop quality and…
-
4 أسباب تجعل دراسة رسم خرائط درجات الحرارة ضرورية لمخازن التبريد المستخدمة في السياحة الغذائية في المملكة العربية السعودية دراسة توزيع درجات الحرارة
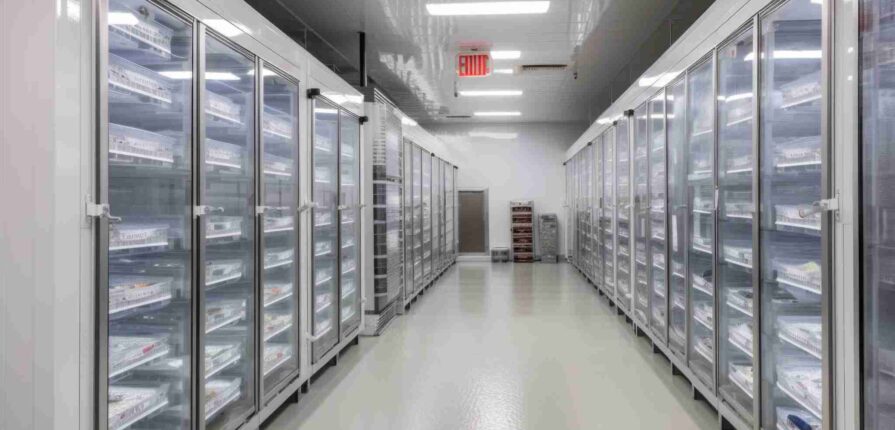
تشهد السياحة الغذائية في المملكة العربية السعودية نموًا متسارعًا، مدعومة بالفنادق الفاخرة، والمطاعم العالمية، والمهرجانات الثقافية، والفعاليات الكبرى في مدن مثل الرياض، جدة، والدمام. وتعتمد هذه التجارب السياحية على مكونات غذائية عالية الجودة تتطلب تخزينًا دقيقًا في درجات حرارة محكومة. وهنا تأتي أهمية دراسة رسم خرائط درجات الحرارة لضمان سلامة وجودة الأغذية في مخازن التبريد…
-
4 Reasons Temperature Mapping Is Essential for Cold Storage Used in Saudi Food Tourism

Food tourism is rapidly growing across Saudi Arabia, driven by luxury hotels, international restaurants, cultural festivals, and large-scale events in cities such as Riyadh, Jeddah, and Dammam. From fresh seafood and premium meats to dairy, desserts, and specialty ingredients, food served to tourists must meet the highest standards of quality and safety. Cold storage facilities…
-
8 مناطق حرجة لدرجات الحرارة تم اكتشافها في مستودعات الأغذية التي تخدم جدة والدمام دراسة توزيع درجات الحرارة
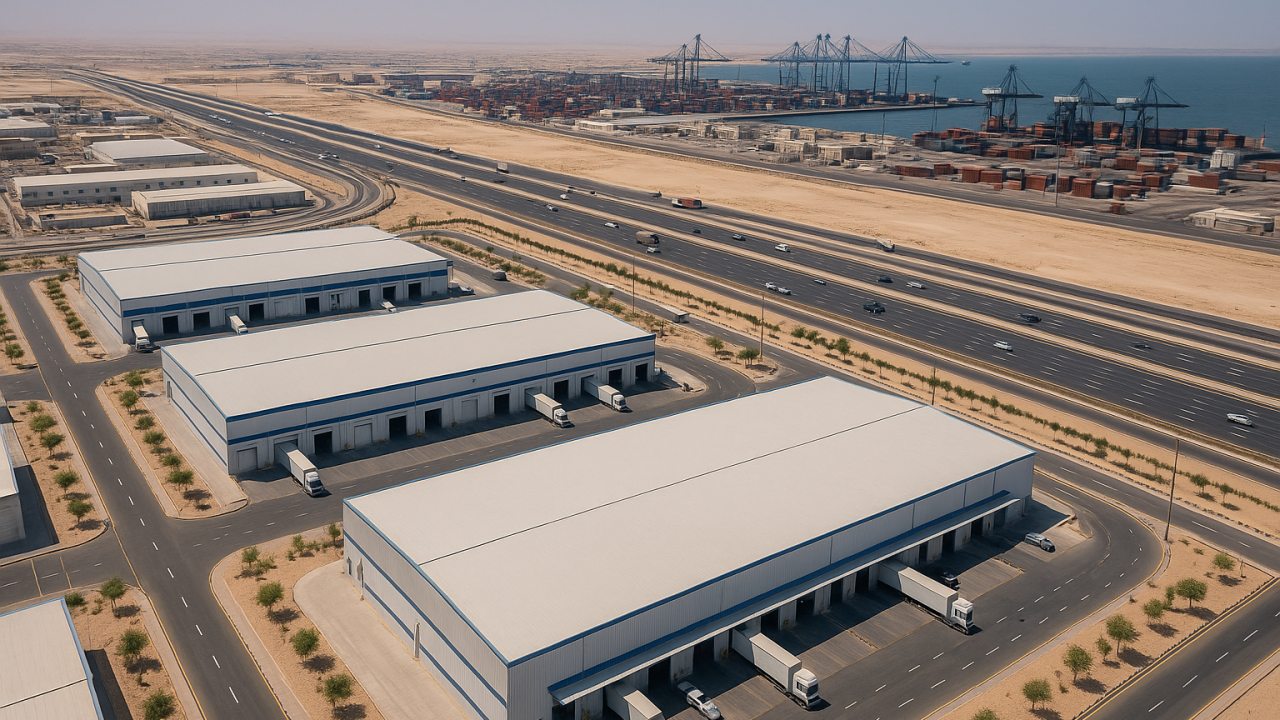
تلعب مستودعات الأغذية التي تخدم مدنًا رئيسية مثل جدة والدمام دورًا محوريًا في سلسلة الإمداد الغذائي داخل المملكة العربية السعودية. تتعامل هذه المستودعات مع كميات كبيرة من المنتجات المبردة والمجمدة والمخزنة في درجات حرارة محيطة، والتي يجب الحفاظ عليها ضمن نطاقات حرارية دقيقة. وبسبب ارتفاع درجات الحرارة والرطوبة العالية والعمليات التشغيلية المستمرة، يصبح التحكم في…
-
8 Critical Temperature Zones Found in Food Warehouses Serving Jeddah & Dammam
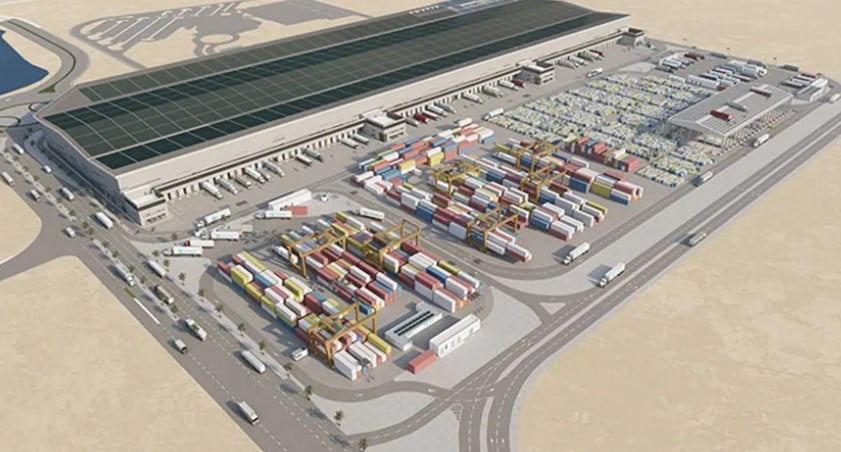
Food warehouses serving major commercial hubs such as Jeddah and Dammam play a vital role in Saudi Arabia’s food supply chain. These facilities handle large volumes of chilled, frozen, and ambient food products that must be stored under strict temperature conditions. Due to high ambient temperatures, humidity, and continuous operations, maintaining uniform temperature control is…
-
كيف تدعم دراسات رسم خرائط درجات الحرارة رحلة الغذاء من المزرعة إلى السوق في جميع أنحاء المملكة العربية السعودية دراسة توزيع درجات الحرارة

تمثل سلامة الغذاء وجودته خلال رحلته من المزرعة إلى السوق تحديًا كبيرًا في المملكة العربية السعودية، نظرًا لطول مسافات النقل، والظروف المناخية القاسية، وتعدد بيئات التخزين والمناولة. فمن الحقول الزراعية إلى مراكز التجميع، ثم إلى مستودعات التخزين ووسائل النقل وأسواق البيع، يُعد التحكم في درجات الحرارة عنصرًا أساسيًا للحفاظ على جودة المنتجات الغذائية. وهنا تبرز…
-
How Temperature Mapping Studies Support Farm-to-Market Food Travel Across Saudi Arabia
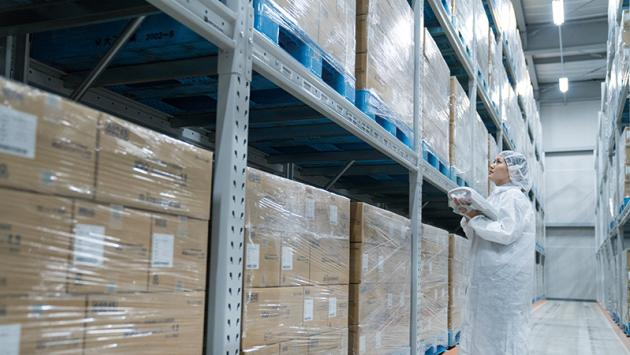
Ensuring food safety from farms to consumer markets is a critical challenge across Saudi Arabia, where long transportation distances, extreme climate conditions, and diverse storage environments can impact product quality. From agricultural fields to processing centers, warehouses, transport vehicles, and retail outlets, maintaining the right temperature is essential. A temperature mapping study plays a vital…
-
3 رؤى أساسية من دراسات رسم خرائط درجات الحرارة لمطابخ الفنادق والمنتجعات في الرياض وجدة دراسة توزيع درجات الحرارة

تعمل مطابخ الفنادق والمنتجعات في المملكة العربية السعودية ضمن بيئة تشغيلية عالية المتطلبات، حيث تُعد سلامة الأغذية والامتثال للأنظمة من الأولويات الأساسية، خاصة في المدن السياحية والتجارية الكبرى مثل الرياض وجدة. ومع ارتفاع درجات الحرارة الخارجية، وكثرة عمليات الطهي والتخزين، يصبح التحكم الدقيق في درجات الحرارة تحديًا حقيقيًا. وهنا تأتي أهمية دراسة رسم خرائط درجات…
-
3 Key Temperature Mapping Insights for Hotel & Resort Kitchens in Riyadh and Jeddah

Hotel and resort kitchens in Saudi Arabia operate under intense pressure to maintain food safety, quality, and regulatory compliance—especially in high-demand hospitality hubs like Riyadh and Jeddah. With large-scale food preparation, multiple storage zones, and constant movement between hot and cold areas, managing temperature consistency becomes a critical challenge. This is where a temperature mapping…
Search
About
In today’s fast-paced world, where quality, compliance, and safety are top priorities across industries, temperature mapping has become more than a regulatory requirement—it’s now a strategic tool. As industries like pharmaceuticals, food production, and logistics continue to evolve, temperature mapping is undergoing its own transformation through innovation and digital integration.
Archive
Categories
Recent Posts
- 9 تحديات لرسم خرائط درجات الحرارة في الزراعة السعودية — وكيف تحلها الدراسات المتخصصة دراسة توزيع درجات الحرارة
- 9 Temperature Mapping Challenges in Saudi Agriculture — And How Studies Solve Them
- 4 أسباب تجعل دراسة رسم خرائط درجات الحرارة ضرورية لمخازن التبريد المستخدمة في السياحة الغذائية في المملكة العربية السعودية دراسة توزيع درجات الحرارة
- 4 Reasons Temperature Mapping Is Essential for Cold Storage Used in Saudi Food Tourism
- 8 مناطق حرجة لدرجات الحرارة تم اكتشافها في مستودعات الأغذية التي تخدم جدة والدمام دراسة توزيع درجات الحرارة
Tags
Gallery


